
Run a Profit and Loss report
See your income, cost of goods sold, expenses and net profit for any period, and compare it with the year so far or the same dates last year.
Where to find it
AccountingReportsProfit and Loss
Steps
- Open Accounting > Reports and choose Profit and Loss under Statements.
- Set the period. Type the From date and the To date (DD/MM/YYYY). Press Tab after each one.
- Read the report from the top: Income (what you sold), Cost of Goods Sold, Gross Profit (the difference), then your Expenses, and Net Income at the bottom. Each account shows its debits, credits and balance for the period.
- Choose Period vs Year-to-Date in the box next to PDF. A second column shows the same figures from 1 January to your To date.
- Choose vs Previous Year to line the period up against the same dates last year. The report adds a Variance column and a percentage.
- Click PDF to open a printable copy, or XLSX to download an Excel file.
Note
The report only counts posted entries. A draft invoice or bill does not change a number until you confirm it. Choose No comparison in the same box to go back to a single column.
Tip
To see profit for each customer instead of for the whole company, use P&L by Job.
What happens next
To see what the company owns and owes on the last day of the period, run the Balance Sheet.
Was this lesson helpful?
Thank you for the feedback.
Keep learning
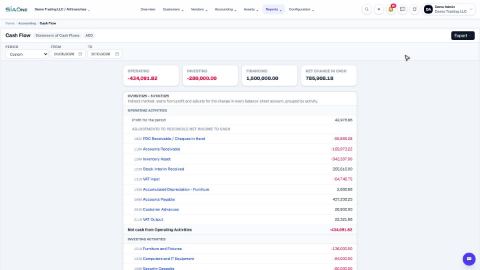
Run the Cash Flow report
See where your cash came from and where it went in a period, split into operating, investing and financing activity.
Run a Profit and Loss by Job
See income, cost of goods sold and net profit side by side for each customer or job, and compare only the ones you choose.
Check the books with the Trial Balance and General Ledger
Use the Trial Balance to see every account's balance and check that debits equal credits, then open the General Ledger to see the entries behind any account.
 1:19
1:19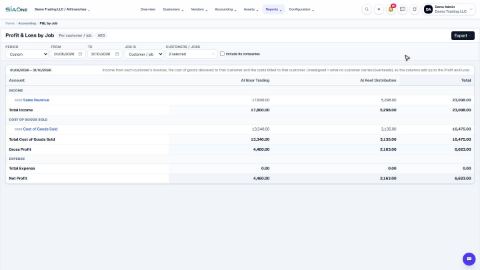 1:26
1:26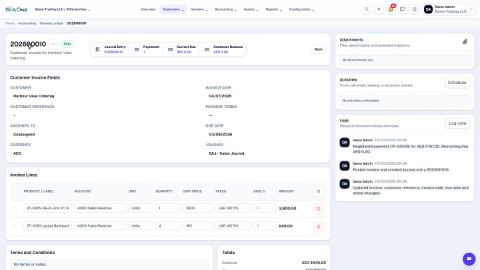 1:35
1:35