
Run a Profit and Loss by Job
See income, cost of goods sold and net profit side by side for each customer or job, with the overheads in an Unassigned column, and compare only the ones you choose.
Where to find it
AccountingReportsP&L by Job
Steps
- Open Accounting > Reports and choose P&L by Job under Statements.
- Type the From and To dates and press Tab after each, or pick a ready-made Period.
- Each column is a customer or job. The rows show Income, Cost of Goods Sold, Gross Profit, Expense and Net Profit for that column. The customers with the most income are on the left. Income comes from the customer's invoices, cost of goods sold from what you delivered to them, and expenses from the bills and cash purchases tagged to them.
- Scroll to the right. Unassigned holds what no customer carries, such as rent and other overheads, and Total adds all the columns. The Total column matches the company Profit and Loss for the same dates.
- Job is chooses what each column stands for: Customer / job (the default) or Project. Choose Project to group by project instead. Anything that carries no project stays in Unassigned.
- Open the Customers / Jobs box and tick only the customers you want to compare. Click outside the box to close it.
- Click Export and choose PDF, Excel or CSV.
Note
The report only counts posted entries. When you tick only some customers, the Unassigned column is left out, so the columns then add up to those customers only.
What happens next
For one line per customer with a profit margin, use Customer profitability.
Was this lesson helpful?
Thank you for the feedback.
Keep learning
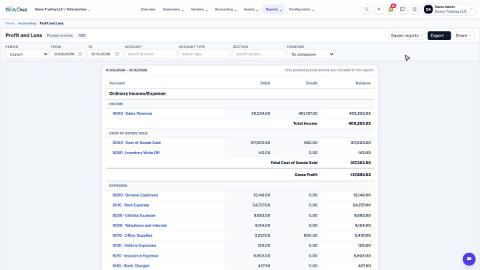
Run a Profit and Loss report
See your income, cost of goods sold, expenses and net profit for any period, compare it with last year or month by month, and open the entries behind any figure.
Run a Balance Sheet
See what the company owns, what it owes and what is left for the owners on any date, and compare it with last month or month by month.
See who owes you money (Aged Receivable)
Use the Aged Receivable report to see every unpaid customer invoice by how overdue it is, then filter it, open an invoice and export the report.
 2:01
2:01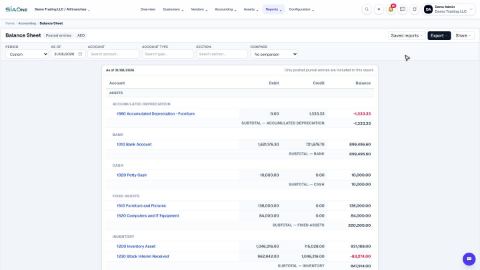 1:57
1:57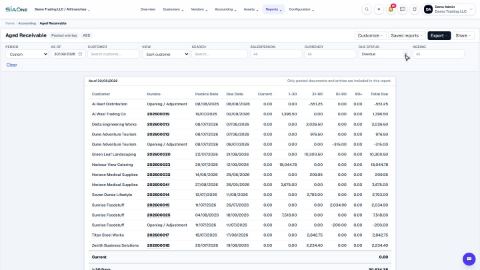 1:48
1:48