
Analyse your sales pipeline (Pipeline Analysis)
See open, weighted, won and lost opportunities and the win rate, grouped by stage, salesperson, team, source, month or lost reason.
Where to find it
CRMReportingPipeline Analysis
Steps
- Open CRM, go to Reporting and choose Pipeline Analysis.
- Type the From and To dates and press Tab after each. The report counts opportunities created in that period.
- Each line is one group, a Stage to begin with. You see the Count, how many are Open, the Open Expected Revenue, the Weighted Revenue (expected revenue times probability), the number Won and their Won Revenue, the number Lost, the Win Rate (won divided by won plus lost) and the Avg Days to Win.
- Open Group By and choose Salesperson, Sales Team, Source, Created Month or Lost Reason to see the same figures in a different way. The totals are the same in every grouping.
- Show chooses Opportunities (the default), Leads, or Leads and Opportunities. Status, Sales Team, Salesperson and Source narrow the list.
- Click Export and choose PDF, Excel or CSV.
Tip
Group by Lost Reason to see why deals are lost, and by Source to see which lead sources win.
What happens next
Work the open opportunities: move an opportunity through the pipeline.
Was this lesson helpful?
Thank you for the feedback.
Keep learning
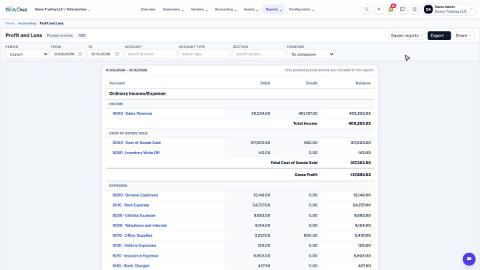
Run a Profit and Loss report
See your income, cost of goods sold, expenses and net profit for any period, compare it with last year or month by month, and open the entries behind any figure.
Run a Balance Sheet
See what the company owns, what it owes and what is left for the owners on any date, and compare it with last month or month by month.
Run the Cash Flow report
See where your cash came from and where it went in a period, split into operating, investing and financing activity.
 2:01
2:01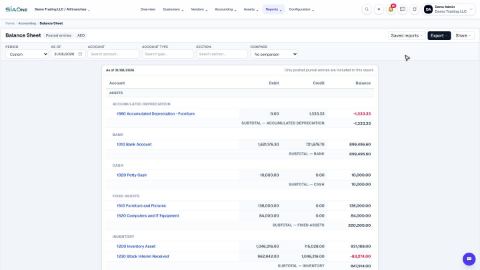 1:57
1:57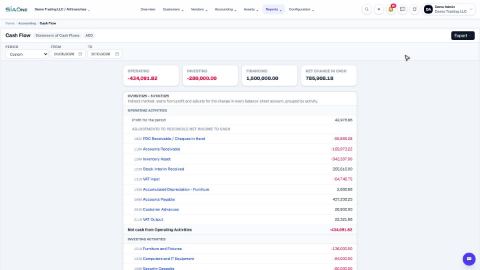 1:33
1:33